A Few Examples of Pictures (Using MATLAB or c++):
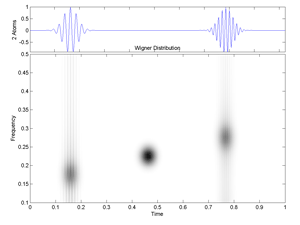
Fig.23 Wigner-Ville Time-Frequency Distribution of two Gabor atoms (colormap gray scale version). Note the interference component.
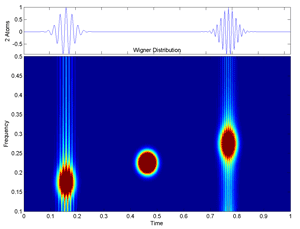
Fig.22 Wigner-Ville Time-Frequency Distribution of two Gabor atoms (colormap jet version).
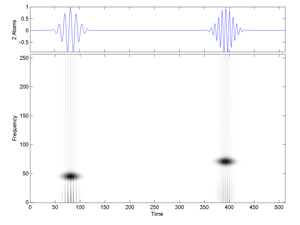
Fig.5.51 Cohen Time-Frequency Distribution of two Gabor atoms. The Alias-Free Generalized Time-Frequency Distribution provides analogous results.
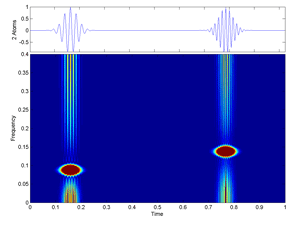
Fig.25 Alias-Free Generalized Time-Frequency Distribution of two Gabor atoms.
Fig.26 Time-Frequency Spectrogram of the signal "transients".
Fig.27 Wigner-Ville Time-Frequency Distribution of the signal "transients".
Fig.28 Cohen Time-Frequency Distribution of the signal "transients".
Fig.29 Cohen Time-Frequency Distribution of the signal "transients" (jet version).